InfluxDB, Telegraf, Grafana: Your Ultimate Setup Guide
InfluxDB, Telegraf, Grafana: Your Ultimate Setup Guide
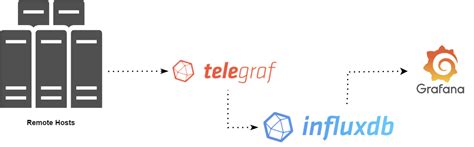
Alright guys, buckle up! Today, we’re diving deep into setting up a seriously powerful monitoring stack: InfluxDB, Telegraf, and Grafana . If you’re looking to keep tabs on your systems, applications, or anything that generates data, this trio is your best friend. Think of InfluxDB as the super-organized database that stores all your metrics, Telegraf as the tireless agent that collects and ships that data, and Grafana as the slick dashboard that makes all that data look chef’s kiss amazing. We’re going to walk through how to get this bad boy up and running, step-by-step, so you can stop guessing and start knowing what’s going on.
Table of Contents
Why This Trio Rocks
So, why bother with InfluxDB, Telegraf, and Grafana? Simple: performance monitoring made easy and insightful . InfluxDB is a time-series database, meaning it’s built from the ground up to handle data that changes over time – precisely what metrics are. This makes it incredibly fast and efficient for storing and querying all those little data points you’ll be collecting. Telegraf, on the other hand, is this super lightweight, plugin-driven agent. It’s like the ultimate data collector. Need to monitor CPU usage? Got a plugin for that. Want to track network traffic? Yep, plugin. Database performance? You bet. Its flexibility means you can pull metrics from virtually anywhere without breaking a sweat. And then there’s Grafana. Oh, Grafana! This is where the magic happens visually. It takes all the data crammed into InfluxDB and turns it into beautiful, interactive dashboards. You can create custom graphs, set up alerts, and really get a feel for the health and performance of your systems. It’s the perfect way to visualize trends, spot anomalies, and troubleshoot issues before they become major headaches. Together, these three form a robust, scalable, and highly customizable monitoring solution that’s perfect for everything from personal projects to enterprise-level infrastructure. Seriously, once you get this set up, you’ll wonder how you ever lived without it.
Step 1: Installing InfluxDB - Your Data’s New Home
First things first, let’s get
InfluxDB
installed. This is where all your precious metrics will live. InfluxDB is a time-series database, which is basically a database optimized for handling data that has a timestamp associated with it. Think of it like a super-efficient filing cabinet specifically designed for data that arrives in a constant stream over time, like sensor readings, application performance metrics, or server statistics. The installation process is pretty straightforward, and it varies a bit depending on your operating system. For most Linux distributions, you’ll be using your package manager. For example, on Debian/Ubuntu systems, you’d typically add the InfluxData repository and then install it using
apt-get
. It usually involves a few commands like downloading a signing key, adding the repository details to your sources list, and then running
sudo apt-get update && sudo apt-get install influxdb
. If you’re on a Red Hat-based system like CentOS or Fedora, you’ll be using
yum
or
dnf
, and the process involves downloading an RPM package or adding a repository. For Windows and macOS, they offer downloadable installers which are usually a breeze to get going. Once installed, you’ll want to make sure the InfluxDB service is running. On Linux, this typically means enabling and starting the service using
systemctl enable influxdb
and
systemctl start influxdb
. After it’s running, you can interact with InfluxDB using its command-line interface (CLI) called
influx
. You can fire this up by just typing
influx
in your terminal. From there, you can create databases, users, and manage your data. For our setup, we’ll need to create a database to store the metrics collected by Telegraf. You can do this within the
influx
CLI by typing
CREATE DATABASE telegraf
(or whatever you want to name it). It’s also good practice to create a dedicated user for Telegraf to use, ensuring better security and control over who can access your data. So, you’d typically issue commands like
CREATE USER telegraf WITH PASSWORD 'yourpassword'
and then
GRANT ALL ON telegraf TO telegraf
. Remember to replace
'yourpassword'
with a strong, unique password, guys! This initial setup is crucial because it lays the foundation for everything else. A well-configured InfluxDB ensures that your data collection and retrieval will be smooth and efficient, preventing bottlenecks down the line as your monitoring needs grow. Don’t skip this part, and double-check your configurations! It’s better to get it right from the start.
Step 2: Installing Telegraf - The Data Collector Extraordinaire
Next up is
Telegraf
, our trusty data collector. Think of Telegraf as the ultimate data gatherer. It’s a lightweight, open-source agent that’s designed to collect metrics and data from all sorts of sources and then send it to wherever you need it – in our case, InfluxDB. The beauty of Telegraf lies in its plugin-driven architecture. It comes with a vast collection of pre-built input plugins that can gather data from your operating system (like CPU, RAM, disk I/O), running applications (like Nginx, Redis, MySQL), cloud services, and even custom applications. It also has output plugins to send this data to various destinations, with InfluxDB being our target. Installation is usually as simple as InfluxDB. On Linux, you’ll again use your package manager. For Debian/Ubuntu, it’s
sudo apt-get install telegraf
, and for Red Hat-based systems, it’s
sudo yum install telegraf
or
sudo dnf install telegraf
. Windows and macOS also have installers available. Once Telegraf is installed, the real configuration begins. Telegraf’s main configuration file is typically located at
/etc/telegraf/telegraf.conf
on Linux systems. This file is your command center. You’ll need to configure the
input plugins
to tell Telegraf
what
data to collect and the
output plugins
to tell it
where
to send that data. For our setup, the most important part is configuring the InfluxDB output plugin. You’ll find a section for
[[outputs.influxdb]]
. Here, you need to specify the URL of your InfluxDB instance (usually
http://localhost:8086
if it’s running on the same machine), the database name you created earlier (e.g., `database =
